
A simple guide to understand Synetiq’s Approach metric
At Synetiq we use biometric sensors to detect and understand people’s emotional reactions. Based on the data, we create our metrics to ‘interpret’ these biological changes to understandable and actionable insights. In this upcoming series, we will give insight into the scientific background of each of our metrics.
Our Approach metric shows whether people have positive or negative feelings towards what they’ve seen or experienced. The name of the metric comes from the phenomenon called approach-withdrawal motivation, which is the term that describes whether a person wants to get closer to a stimuli, or distance themselves from it. (Feltman & Elliot, 2012)
As emotions are created by our brains, we observe the brain’s activity in order to create this metric.
In this article:
What is the connection between approach-withdrawal motivation and brain activity?
How can we measure brain activity?
How do we visualize and interpret data from the EEG? - examples
What is the connection between approach-withdrawal motivation and brain activity? What do we measure?
To find the link between the two, first we have to talk about the structure of our brain regions.

Brain lobes and their functions. (Source of image: www.headway.org.uk)
The brain consists of 4 lobes. The lobes are easily distinguishable by their placement, and they also have distinctive functions. The frontal lobe is mainly responsible for conscious thoughts and decisions, and is also rich in dopamine sensitive neurons which are responsible for cognitive processing associated with reward and motivation.
The brain can also be divided into 2 hemispheres. Both of the hemispheres physically look the same and are structurally almost identical; the 4 lobes and their representative functions are apparent on both, too. But there is a slight difference in their activity related to different tasks. For example, both hemispheres play a role in language processing, and both have the same area dedicated to these processes. Still, there is a difference between them: the left hemisphere is usually more active than the right when the brain processes speech.
This asymmetry is also present for emotions, which are related to the frontal lobe. Studies have found that an increase in left frontal activity shows positive feelings and approach motivation, whereas increase in right frontal activity can be interpreted as negative feelings and withdrawal motivation. And so now we know what we need to observe to get our wanted information. But how?
2. How can we measure brain activity?
To understand how we can measure brain activity, we first have to dig a little deeper into our brain, and understand how its cells work.
Neurons, the „building blocks” of the nervous system, carry out the vast majority of the information processing and transmitting within our bodies. When they communicate, they create a local, very small voltage difference, which we can measure with a tool called electroencephalograph or EEG. It looks like this:

EEG headset in action
The EEG headset is placed on the top of the scalp, being far from the cells in our brain, making individual cell activity unmeasurable. So how does it work? The key is in the numbers: because the brain has thousands of neurons even in just 1 mm3, we can detect activity in even relatively small regions on the scalp. As we don’t need to know whether two specific neurons are communicating or not, instead we only want to observe how active the neurons are in the frontal lobes, we have sufficient information to show approach and withdrawal.
3. How do we visualize and interpret data from the EEG headsets? - examples
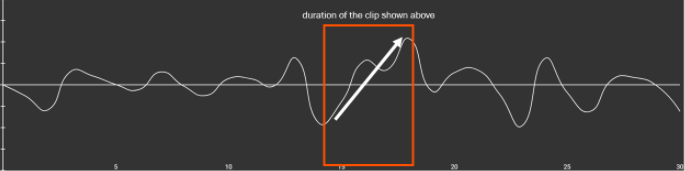
In order to be able to interpret audience reactions, the raw data from the EEG headset goes through a complex processing pipeline, which cleans and aggregates it for visualization. Visualization is designed to be intuitively understandable: a baseline is constructed from the neutral state of the audience, and upward differences show positive reactions, downward differences show negative ones. Let’s see it in action!
As we have previously mentioned, increase in right frontal activity can be interpreted as withdrawal, or negative reaction to a stimuli. An easily understandable example for this is disgust. When a person faces something they perceive as unappetizing or unpleasant, withdrawal motivation manifests itself, and it shows up on our data visualization, too. In the case of this dandruffy scalp in a shampoo commercial, this is exactly what happened:

Closeup of dandruff on scalp in a commercial

Withdrawal reaction of 18-59 year old general audience to unappetizing scene in a commercial
Our visualization shows that the moment the camera zoomed in to the dandruff-closeup, our Approach metric took a downward turn, signaling withdrawal motivation. Viewers wanted to distance themselves from the images they were seeing, as they were most likely disgusted by them.
Similarly, increase in left frontal brain activity is interpreted as approach, or a positive reaction to stimuli. To match the negative stimuli, let’s see how our audience reacted to images of appetizing food and people enjoying eating it.

Appetizing food in a commercial
Approach reaction of 18-59 year old general audience to appetizing images in a commercial
Good looking food most often triggers approach motivation, and it shows on our visualization: images of juicy sandwiches, pizza, hamburger and searing meat attracted viewers, the curve took an upward turn, and kept this tendency throughout the whole scene.
written by Nóri Paller & Szimonetta Ézsiás-Nagy
Of course, each person has different experiences and memories which can influence their brains’ reaction to specific elements in an advertisement.
If you liked this short explanation on how we calculate the Approach metric in our analysis, stay tuned for the next articles about engagement and discomfort!
If you would like to read about how emotions are measured in research, check out our previous article here or stay up to date and subscribe to our blog here!
